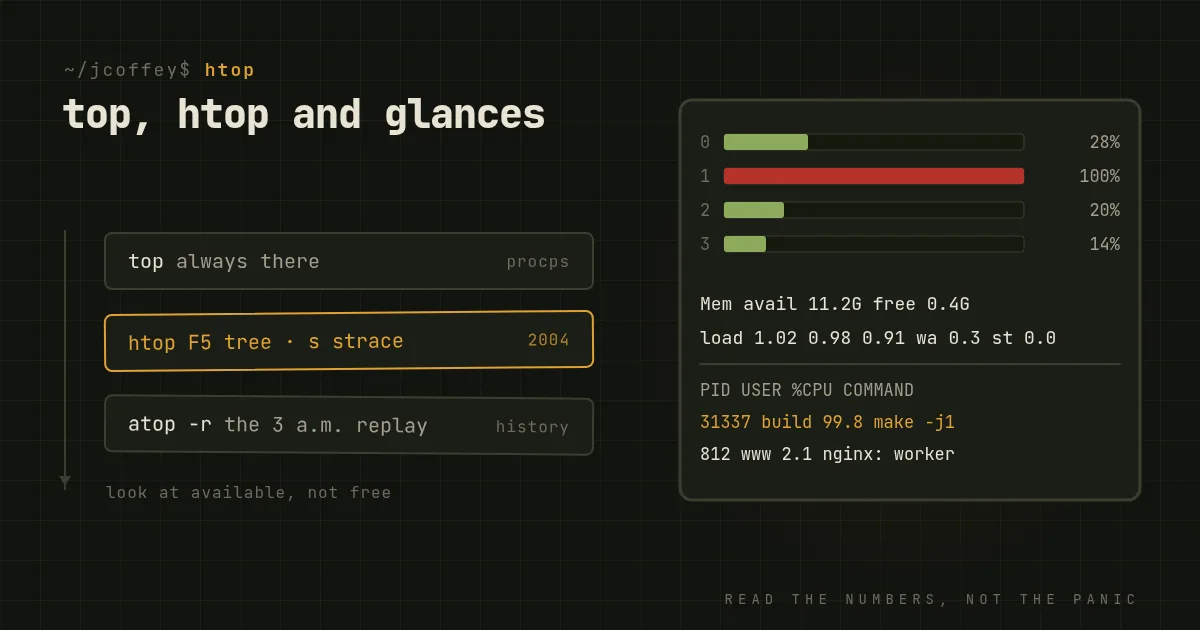
Something is slow. Someone says "the server's at 100 percent." You SSH in and type one of three commands. Which one doesn't matter much. What matters is knowing which numbers to look at and what they're telling you. Most bad calls made from a top screen come from misreading it, not from using the wrong tool.
So here are all three, with the keys worth knowing, and then how to read what they show.
top: always there
top comes with the procps-ng package, which means it's on every Linux system you'll ever log into: rescue shells, containers, ancient appliances. It's the one you can count on, so it's worth knowing beyond q.
The keys that matter:
1splits the CPU line into one line per core. A single-threaded process pinning one core shows up as 12 percent overall on an 8-core machine and 100 percent on one core. Without1you'll miss it.P,MandTsort by CPU, memory and cumulative time.cshows the full command line, so you see which of twentyjavaprocesses it is.Hshows individual threads.kkills a process by PID, andrrenices it.fchooses which columns to show, andWsaves your layout for next time.
For scripts and incident notes, batch mode is the useful part: top -b -n 1 -o %MEM | head -20 gives you a snapshot you can paste into a ticket.
htop: top, made pleasant
htop was written by Hisham Muhammad in 2004. When he stepped back, the community took it over in 2020 as htop-dev, and it's been actively maintained since. It's packaged everywhere, and it's worth installing on any machine you'll spend time on.
What it adds:
- Per-core meters and a memory bar at the top, colored by type, so you see the shape of the load at a glance.
- Tree view with
F5, which shows which parent spawned the forty workers eating your CPU. - Filter with
F4to show only matching processes, anduto show one user's. - Tag processes with the space bar, then
F9to signal them all at once. sattachesstraceto the selected process, andlshows its open files withlsof. That's often the fastest way to see what a stuck process is actually waiting on.F2for setup, including extra columns like per-process disk I/O.- Mouse support, if that's your thing.
glances: everything on one screen
glances is a Python tool by Nicolas Hennion. Instead of focusing on processes, it shows the whole machine at once: CPU, memory, load, network interfaces, disk I/O, filesystems, temperature sensors, Docker containers, and the top processes. Values turn yellow and red as they cross thresholds, and recent alerts are listed at the bottom.
Where it's genuinely different from the other two:
glances -wruns a web interface on port 61208, which is handy for a machine without a convenient terminal. Put it behind authentication or a firewall, because it shows a great deal about the host.- Client and server mode. Run
glances -son a server andglances -c hostfrom your workstation. - Exports. It can feed its numbers to InfluxDB, Prometheus, CSV and more, which turns a terminal tool into a lightweight metrics collector.
The trade-off is weight. It's a Python program that uses noticeably more CPU and memory than top, which matters on the struggling machine you're trying to diagnose.
Two more worth knowing
btopis a newer C++ monitor with graphs for CPU, memory, disks and network. It's the prettiest of the lot and great on a workstation.atopanswers the question none of the others can: what was happening at 3 a.m.? It runs as a service, writes a snapshot to disk every ten minutes by default, and lets you replay history withatop -r. Install it before the incident, not after.
Reading the numbers without fooling yourself
The tool matters less than this part.
Load average isn't CPU usage. On Linux, it's the average number of processes either running or waiting, including those stuck in uninterruptible I/O (state D). Compare it to the number of cores. A load of 8 is fine on 16 cores and a problem on 2. A high load with idle CPUs usually means processes are waiting on disk or a network filesystem, not on the CPU.
Watch wa and st. In the CPU line, wa (iowait) is time spent idle waiting for I/O. If it's high, look at your disks, not your code. st (steal) is time the hypervisor gave your virtual CPU to another guest. If steal is high on a cloud VM, the problem is your neighbors or your instance size, and no amount of tuning inside the VM will fix it.
"Free" memory being low is normal. Linux uses spare memory for the page cache and gives it back the moment programs need it. Look at available, not free. The time to worry is when available is low and swap activity is climbing, or when the kernel's out-of-memory killer shows up in journalctl -k.
RES isn't what a process costs. Shared libraries and shared memory are counted in every process that maps them, so adding up RES across processes overstates usage. For a truer per-process figure, use the PSS value from smem.
100 percent of one process can be fine. A batch job at full speed on one core is a job doing its work. The question is always whether something that should be fast is slow, not whether a number is high.
Which one
topwhen it's all you have, or for a quick snapshot to paste somewhere.htopfor interactive work. Install it everywhere you can.glanceswhen you want the whole machine on one screen, or a quick remote view.atoprunning in the background on anything you care about, so the next "what happened overnight?" has an answer.
None of them replaces real monitoring that keeps history and wakes someone up. They're how you find out what's wrong once you're logged in.